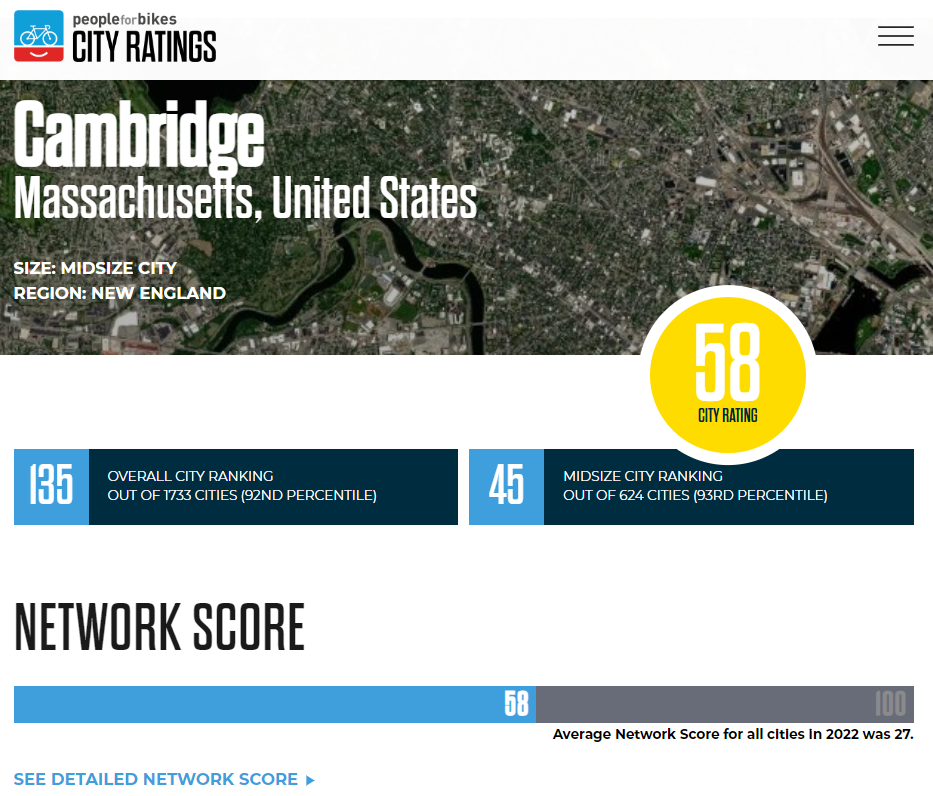
Lookit. No city rating tool for bicycling will ever be perfect. And kudos to PeopleForBikes for trying to measure comfort at a network scale!
But #CambMA being scored and ranked this low ought to be an important calibration data point on your methodology.
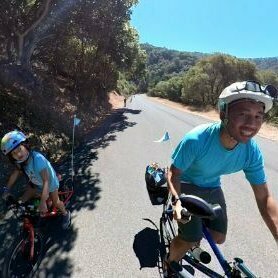
Lots more work to do here, but this is among the very best bicycling cities in North America. It's not debatable.
@itamarst always the correct answer

@bikepedantic winning awards is nice though
@itamarst it absolutely is.
@bikepedantic Maybe mention it to city staff at the next Mass Ave working group meeting?

@bikepedantic Maybe some OpenStreetMap edits could help improve the accuracy (it's based on OSM)
@bikepedantic they were hiring some people to improve the bike data in OpenStreetMap. I'm not too familiar with the data quality in Cambridge but it looks pretty good. Weird results, I'm not sure what else they use to come up with these scores.

@akadouri @bikepedantic Whatever its merits, they’re open about how the rating system is supposed to work.
https://cityratings.peopleforbikes.org/about/how-city-ratings-works
My city, #WallaWallaWA got a "8" and our bicycle network is certainly better than most small cities I have visited.
Good try, but definitely missing something.
@bikepedantic hah. Reading from Berkeley, I had the exact opposite reaction: we scored *way* too high. Which reinforces the point about methodology!
@marcprecipice yeah, Arlington VA (where i lived for 10+ years) consistently scores far far too high on this thing. It's barely behind Cambridge (and might have been ranked higher last year IIRC?), but it's not even close in reality.
@marcprecipice @bikepedantic Whoa, I'm cherry-picking here, but San Pablo Avenue in Berkeley has a top BNA score 😬
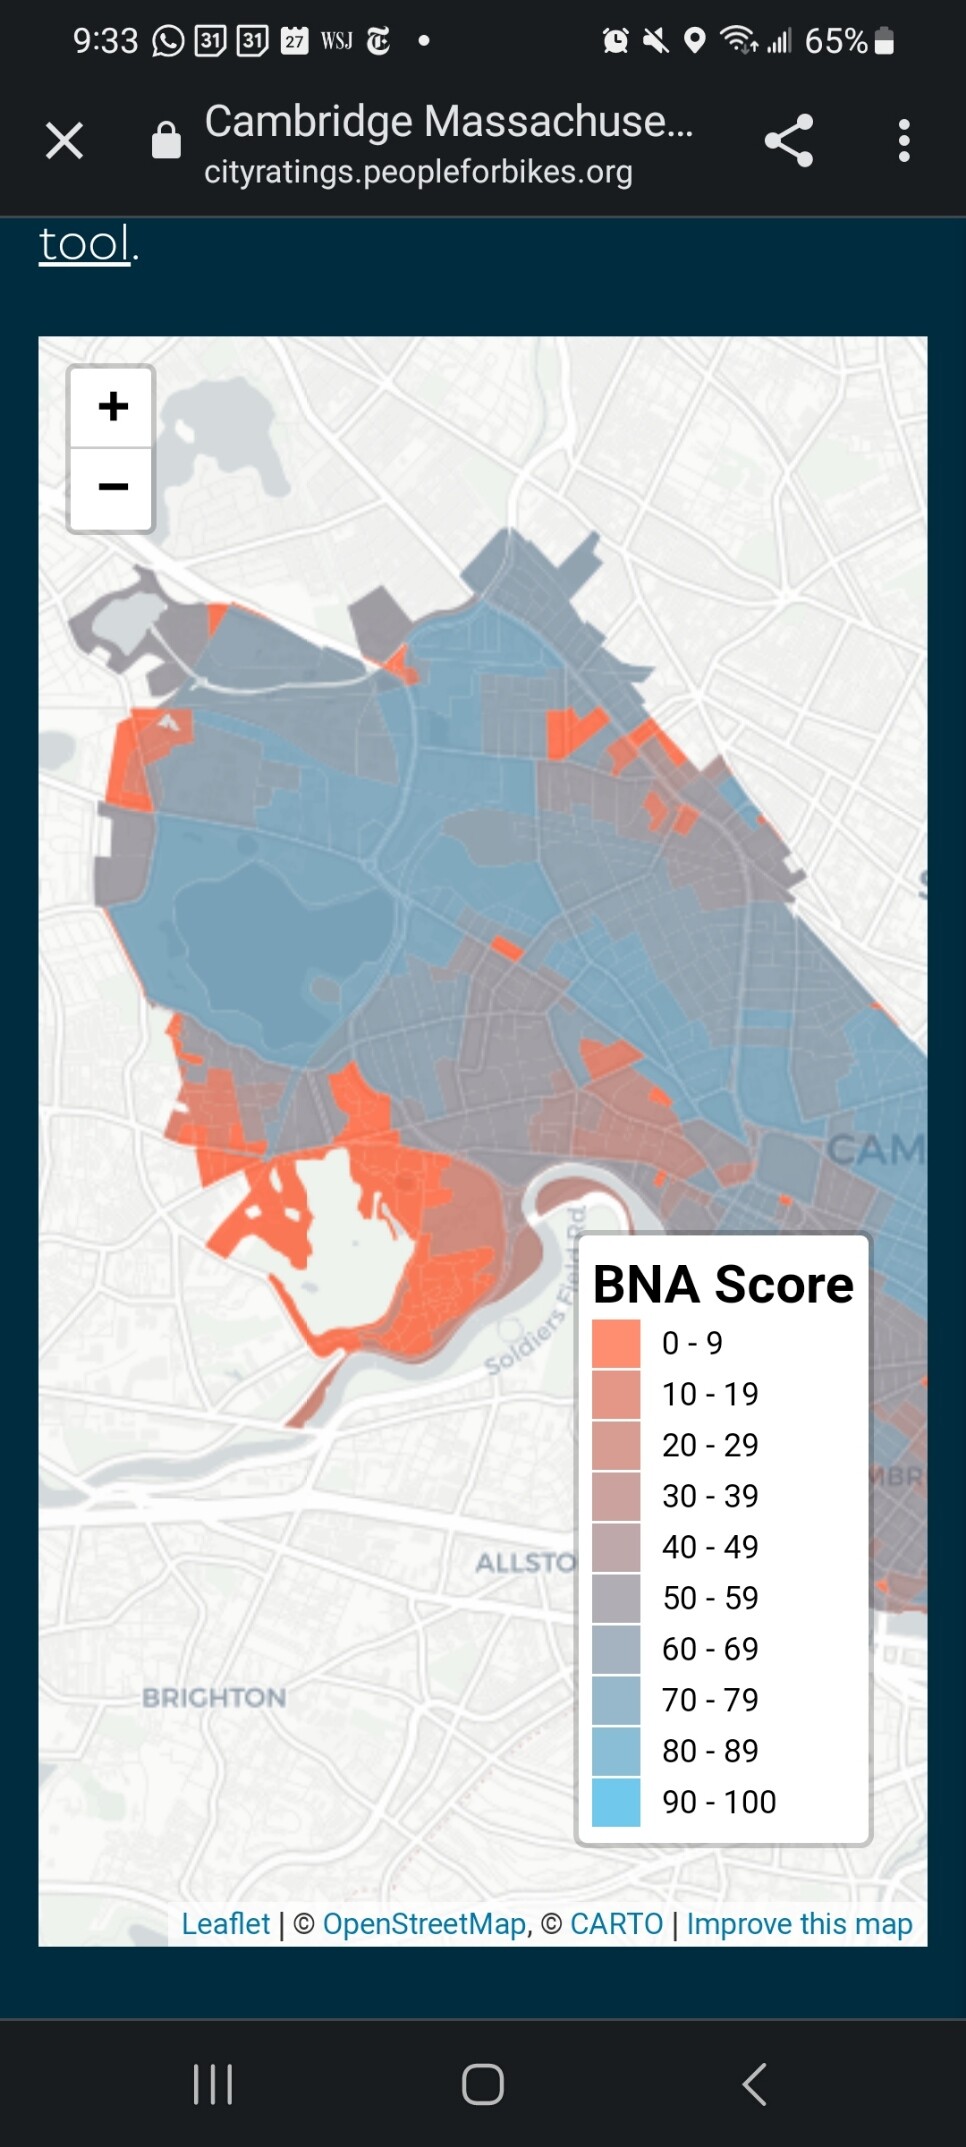
@ascentale @bikepedantic yeah, look at the report map versus the detail map. The latter is more realistic by a lot. San Pablo is high-stress, there.
@marcprecipice @bikepedantic Ahh, the detail map is pretty cool, because you can see that it's hard to get from one place to another without crossing a high-stress road - which hopefully is something that can be factored into the regional map and score computation in the future.
Also weird that the entirety of Cesar Chavez Park is red in the report map, but is all low-stress in the detail map.
@ascentale @bikepedantic totally! I think it’s some smoothing approach to the data in the report map. The result isn’t useful *as a map*. Maybe it’s useful in other ways.

@bikepedantic Those stress maps are fucked up. Metropolitan Ave intersections through Forest Hills (in the NYC map) is low stress? Wtf.

@bikepedantic Mt Auburn cemetary is high stress and Mass Ave is not?

@bikepedantic
Boston and Newton not looking so good, but also I'd disagree pretty hard about their assessment of sections of east boston and downtown boston being somewhat less stressful - - seems like it's based on how many bike paths through parks and bikeshare stations there are.

@bikepedantic I have vague memory of someone asking Joe Barr about it and him saying "we're too busy building stuff to fill out questionnaires"